Visualise how your unified communications services are being consumed by your users with detailed real-time analytics through your own customisable dashboards
VMO2 chose Datatrack for their problem-solving approach and ingenuity. Datatrack tailored an existing product into an elegant, cost-effective solution for VMO2’s unique operational challenges. Our development times and costs were significantly reduced as a result.
We are very pleased with the ongoing dedicated managed service solution and would highly recommend Datatrack for their UC Storm Analytics solution.
A.W.
Manager Messaging, Voice and Telephony VMO2
“Working with Datatrack has been an extremely positive experience. They have gone above and beyond by addressing all our requirements and their expertise and partnership have been invaluable in optimising our systems and moving BT forward.”
“Datatrack plays a vital role in supporting Lumen’s key business functions. We rely on Datatrack’s analytics capabilities to obtain critical insights needed to make the correct business decisions.”
How Storm Can Help You
Storm helps you to fulfil the ROI from your unified communications investment
Deliver your productivity gains
Create operational savings
Enhance customer experience
Increase employee satisfaction
Optimise your communications infrastructure
Fraud detection
Good news
Current CMS and Orbitel Customers
Enhance your legacy CMS and Orbitel call management systems with our new Visualisation Portal. Call us now to find out how!
Visualise your workforce’s entire communications activities in one place giving you the ability to see what is happening and make informed decisions in real time
Cost Saving
Quickly identify areas in your organisation where you can make operational savings through a more efficient use of resources
User Adoption
Identify how your users are adopting and utilising new UC services such as video calling, instant messaging, file transfers etc.
Increase Productivity
Identify where resources can be more effectively utilised and allocated.
• Redeploy employee workload • Response times • Redundant hardware
Collaboration
Provide performance insights into how your UC is helping teams and individuals to work together whilst highlighting areas for further user adoption
Employee Well-being
Knowing your call quality is to the desired standard and alerted to when it’s not. This positively impacts on your team’s working environment.
Customer Experience
Use communications data to see how customers, suppliers, stakeholders journeys are progressing. Set system alarms when wait times or call times are reaching pain thresholds. Tools to enable you to remain in control to deliver great customer experience.
Features
Storm is a unique, all in-one tool to give you the clarity you need
Storm visualises your entire communications consumption in real-time, within bespoke dashboards
If you need unique and specific reporting, you can create an unlimited number of custom reports designed for your business right from your Storm dashboard.
Present your dashboard or wallboards just how your users wish to see them. Widgets can be repositioned and resized in the dashboard to emphasise the importance of the data or to study at high levels of granularity.
Designed for organisations who host or tenant clients on their system. This tenanted business analytics solution not only delivers a global view of communications activities, it enables the secure management environment of individual customers’ data. This provides them with the facility to view their own data in real-time.
Make informed decisions in real time
Storm allows you to focus on the things that matter in the important moments. Take action and get results
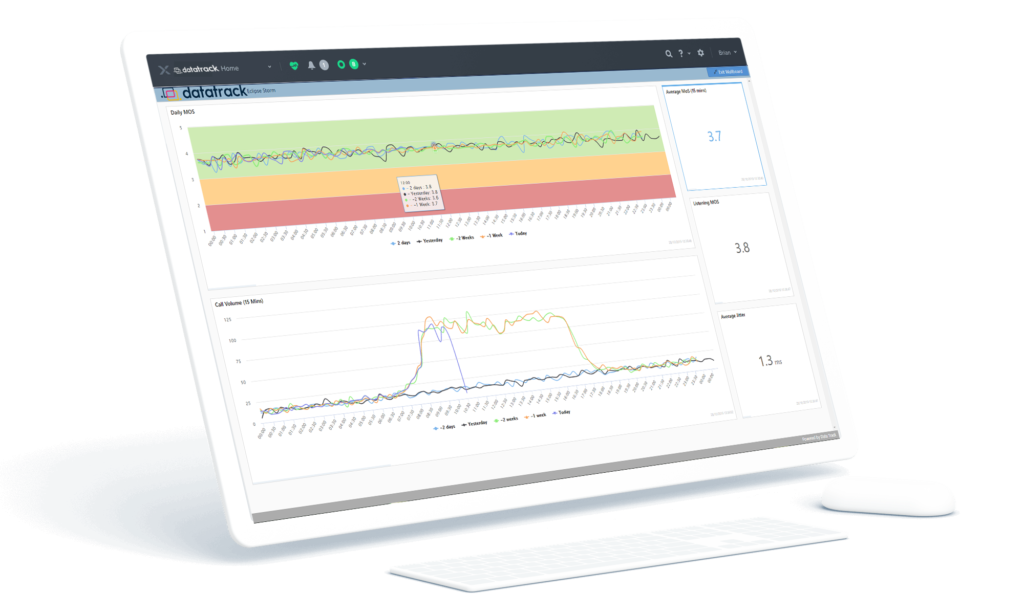
Visual analytics at your fingertips
Storm’s dashboard allows you to change the type of data you want to see. Allowing you to spot trends in real time and enabling you to see how your teams are using platforms. It provides performance comparisons between minutes, days, weeks and years, uses filters to segment any of your data for better clarity.
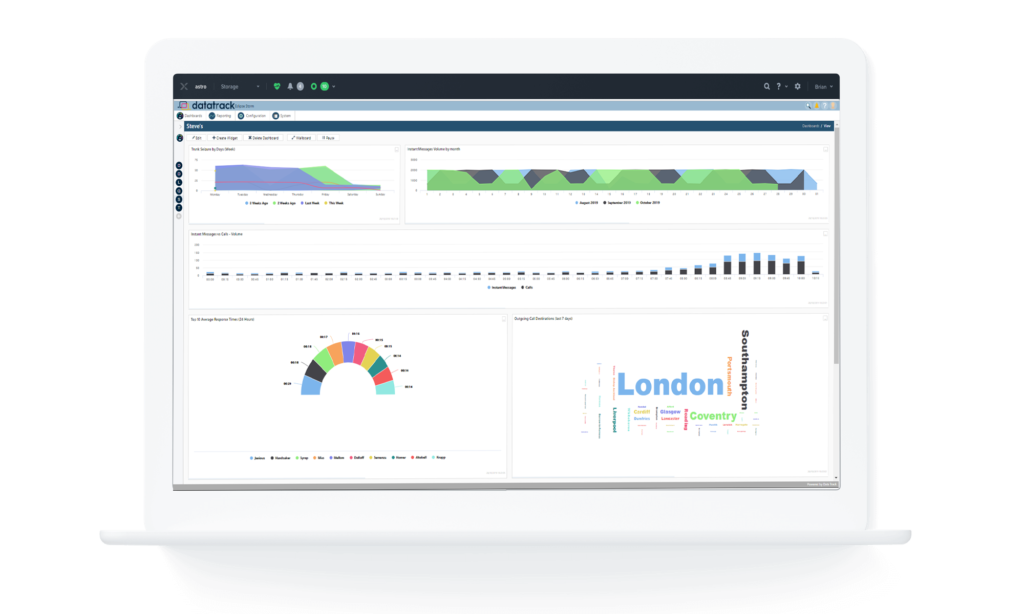
Custom data visualisations
Interactively explore your data with easily customisable dashboards – simply drag and drop. There is a wide variety of visualisation charts to choose from.
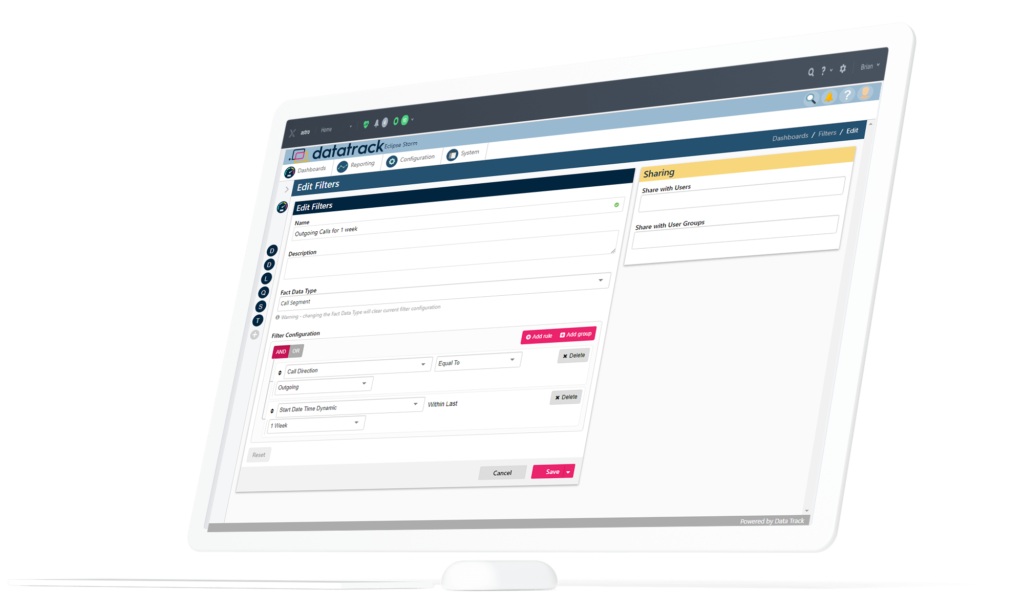
Applied actions
Use context menus to apply common reporting actions like grouping, filtering, aggregating, and sorting.